You’ve heard the phrase, if a tree falls in the woods and no one is around to hear it, does it make a sound?
While I’m not here to argue the philosophy behind that particular phrase, I do think it can be applied to an employee communications strategy:
If you write a blog, and no one reads it, does it exist? The answer to this one is a lot more simple.
Blogs won’t make a difference in your engagement and communications strategy if no one is paying attention to them.

We’ve talked about how to break through the ongoing avalanche of information and cut through the inbox clutter to create standout communications with the right employee communications tools, but how do you really know you’re getting through to people?
Short of asking every individual you come across, it can be a difficult task.
But with the right tools, adapting your internal communications plan to one that you feel confident your employees are engaging with doesn’t have to be such a momentous burden. Here are a few data points you can look at to form insights about your own communications tactics:
Learn more tips on creating powerful employee communications »
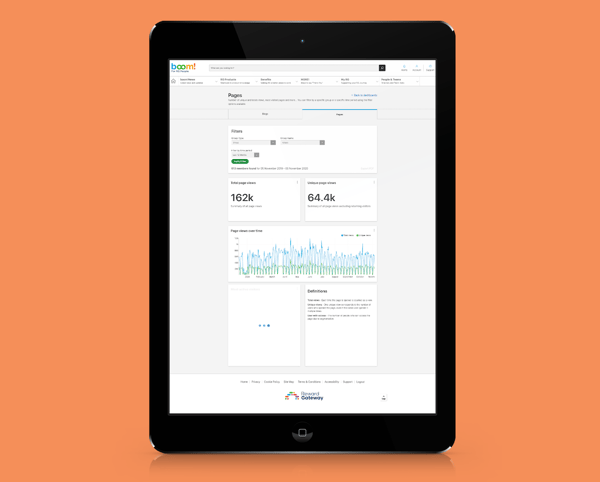
Top viewed posts
This is a more obvious one, but it’s good to understand what topics and issues matter most to your employees. For example, week after week our top-viewed post is the leadership communications Mission Monday post from our CEO, Doug Butler, where he writes his thoughts around our strategy and mission, and normally will add in recognition for a team on accomplishing a strategic goal.

The views on posts can tell you what’s working, and what’s not. An example is our Happy News post, which goes out every Thursday.
At the height of the pandemic, this was a top-read post because people were just looking for a little lightness and smiles throughout their day, but as we enter the 8th month of working from home and ongoing changes around us, this readership has dipped.
We’re now trying out publishing Happy News on our internal Instagram account, which has more than 50% of our employee base currently following, and also bringing “the warm and fuzzies” into our content in new ways, such as reimagining our boomTV centered around each of our values – the first of which was “Be Human.”
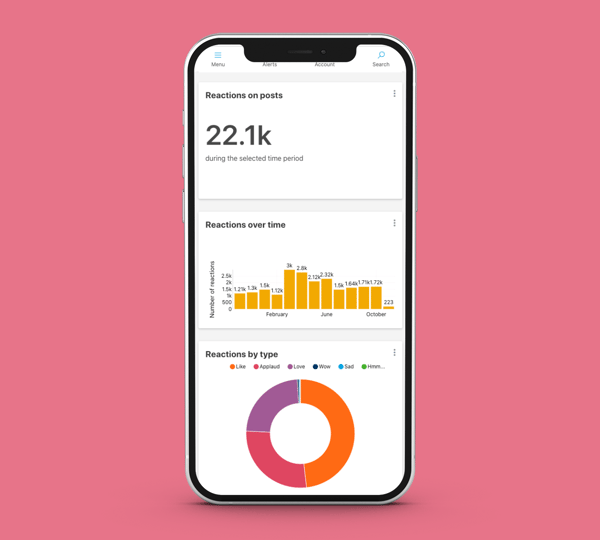
Reaction activity
Another way to see what topics your employees care about is based on more than just the views, but also how people are actively engaging with the post. On our platform, you can react with emojis, comment on posts and even tag others to start conversations within threads. The breakdown of emojis can tell you how others are feeling, for instance, about a big company update, whether they’re excited, confused, sad or more.

If you see a lot of “confused” faces, it may be time for a follow-up post or video!
Time of day for reading
We have a workforce of more than 400 people operating in several different time zones, so we’ve tried to maximize our readership by posting across the most geos at a time to engage a global workforce, for instance something that is UK specific might go out around 9 a.m. UK time (stateside peers are fast asleep!) and something that is globally applicable might go out a little earlier, which is across Australia’s evening and a few hours before the U.S. logs on.
Because you can use our analytics dashboards to filter by location, teams, you can use this to your advantage to determine what blogs should go out to what geo, and at what time to get the most engagement.
You can even segment blogs so that only certain employees can see them, making sure that the most relevant information gets to them at the right time, in the right way.
Dips in readership
No one likes admitting that there’s lower engagement, but it is a reality we have to face at times. We’ve made some strategic changes to when we distribute content, purposefully making Thursday a lighter content day as we’ve seen that teams across the business are more focused on what they have to accomplish by week’s end.
Our mission-critical content, such as our CEO update, important information from our Security or IT teams and news around big company changes stay at the start of the week.
Dashboards can let me know the best days for readership, and spot those lags in readership early to reinvent our editorial calendar on the fly.
From a content perspective, we can also see what kind of media works best for our audience, whether that’s a blog that has video in it, or looking at the length of the post, too.
Opportunities for ambassadors and inclusivity
Most comment and reaction reports can help you see who is engaging the most with your blogs – a lot of times it’s these same people who would make great content allies or culture champions. You can see what they’re actively engaged in and that they are speaking up on issues or topics within the business, so you can reach out to them on new campaigns to help you create new ways to bring it to life.
 Looking at who your contributors are can also help you understand what teams are represented the most (and the least). Much like reward and recognition analytics, this can help you spot teams that may be in need of more attention from the business or could be considered a retention risk.
When we introduced the front-end contributor role earlier this year, it gave many other employees the opportunity to add their voice to our platform. I’ve even opened up a newsfeed where anyone can contribute, which is our new D&I Networks newsfeed.
Our communications dashboard sits alongside analytics for all of our products, which brings me closer to our overall employee engagement strategy and see what’s working (and what isn’t!).
If you need help developing a communications strategy for your business, I’m here to help. Just reach out to me on LinkedIn and we can get the wheels turning!

 Catrin Lewis


